Supports InfluxDB 2 OSS · 2 Cloud · 3 Core · 3 Enterprise

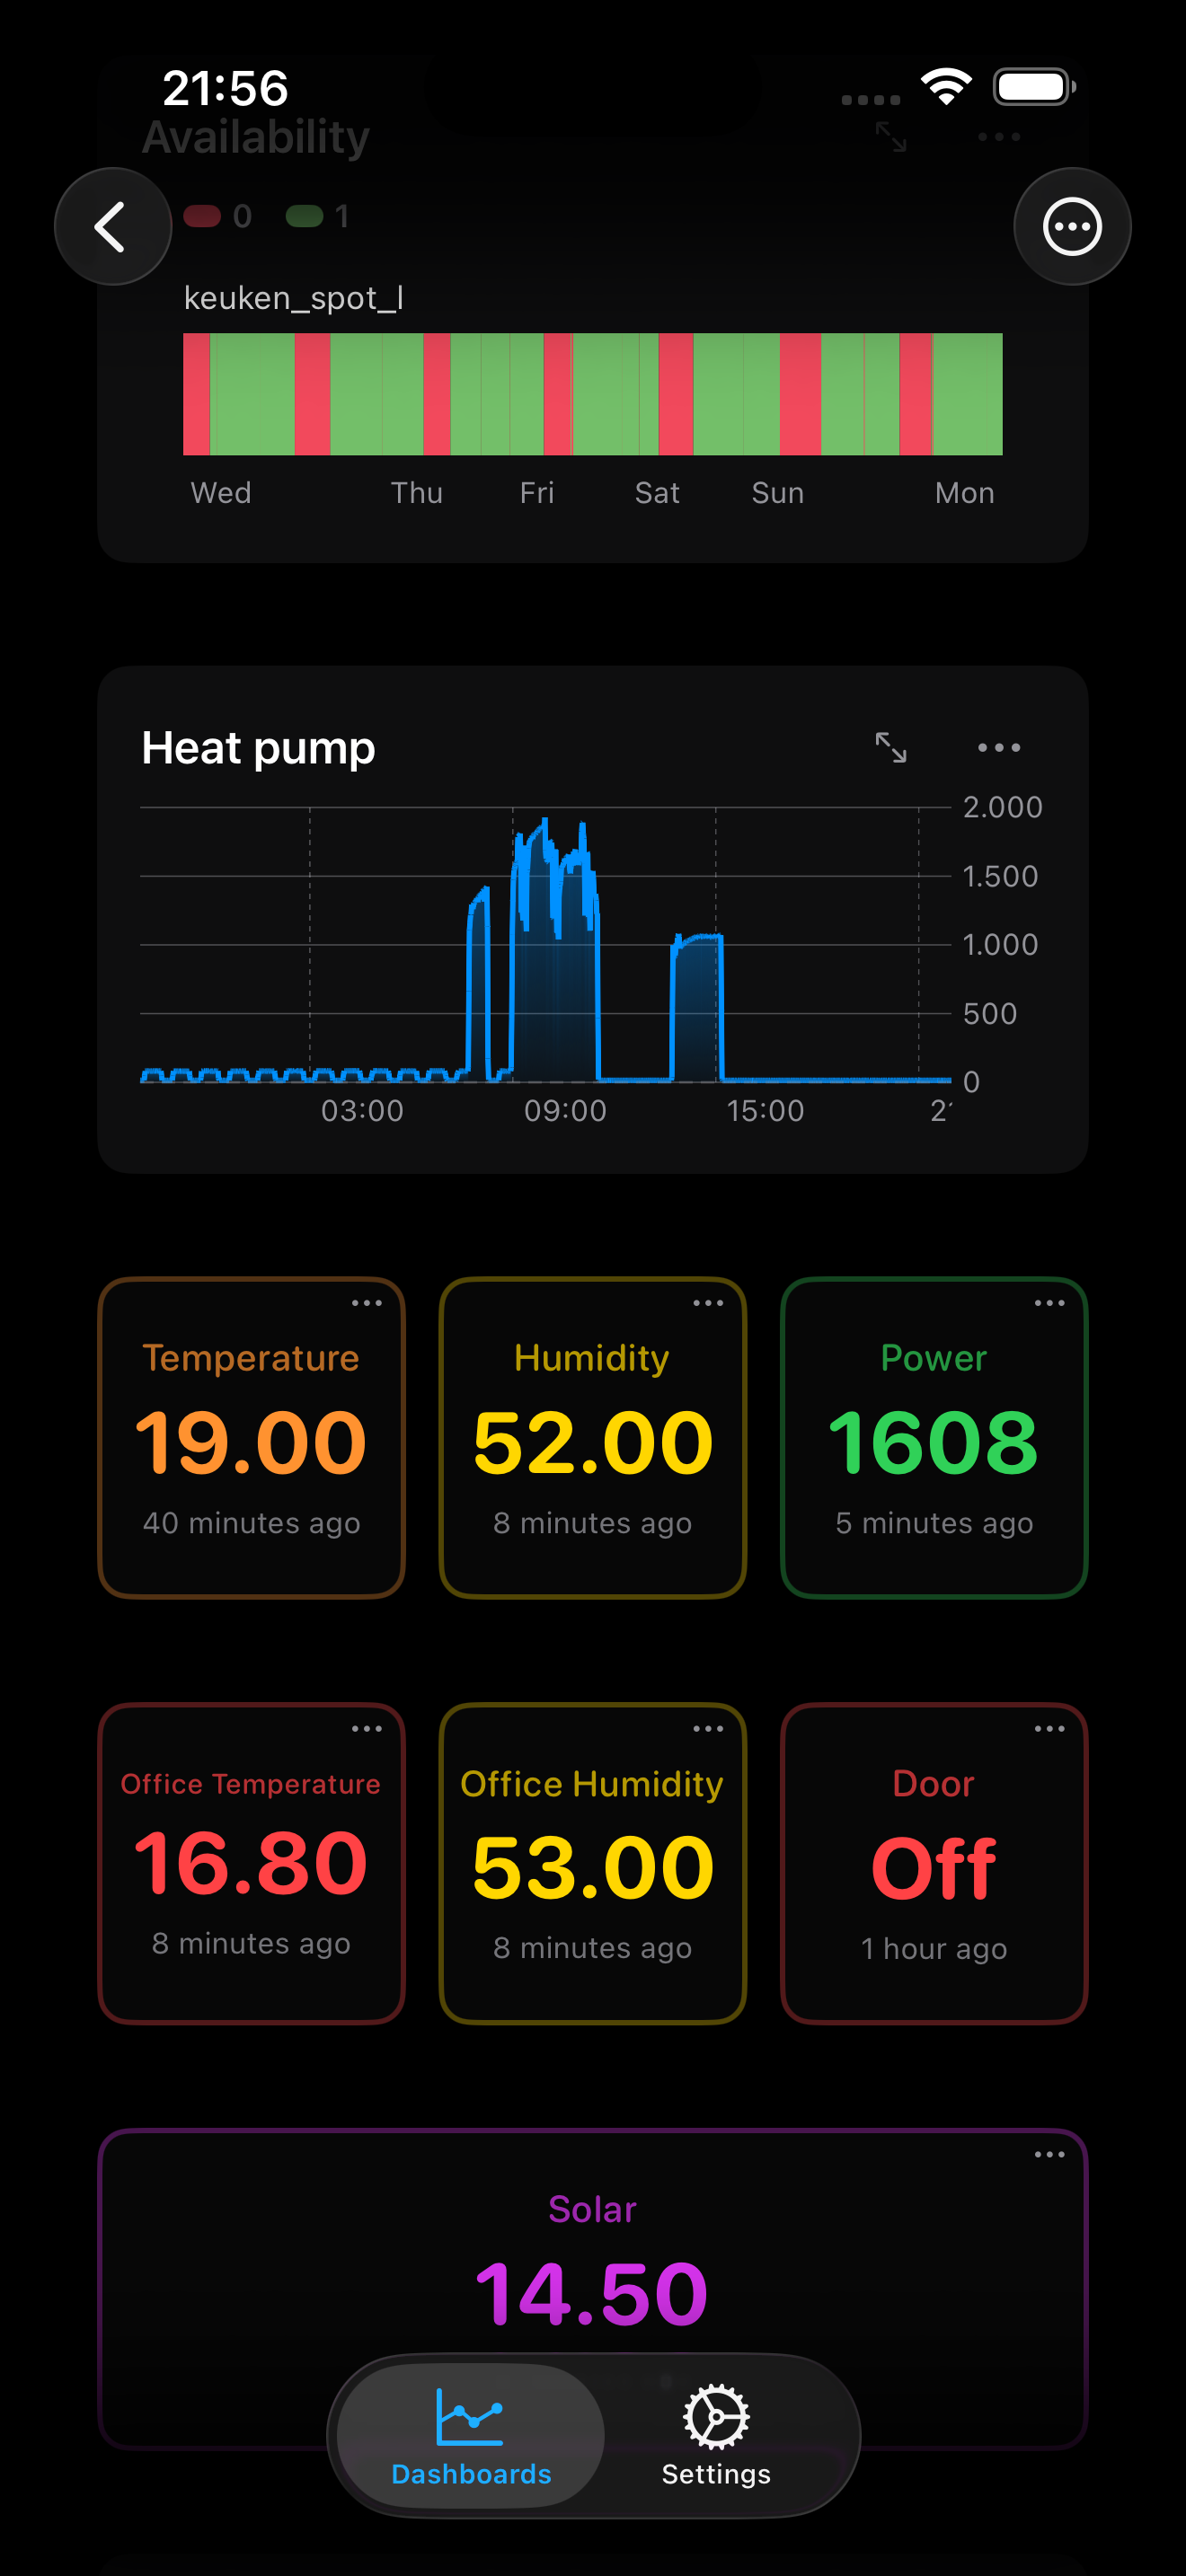
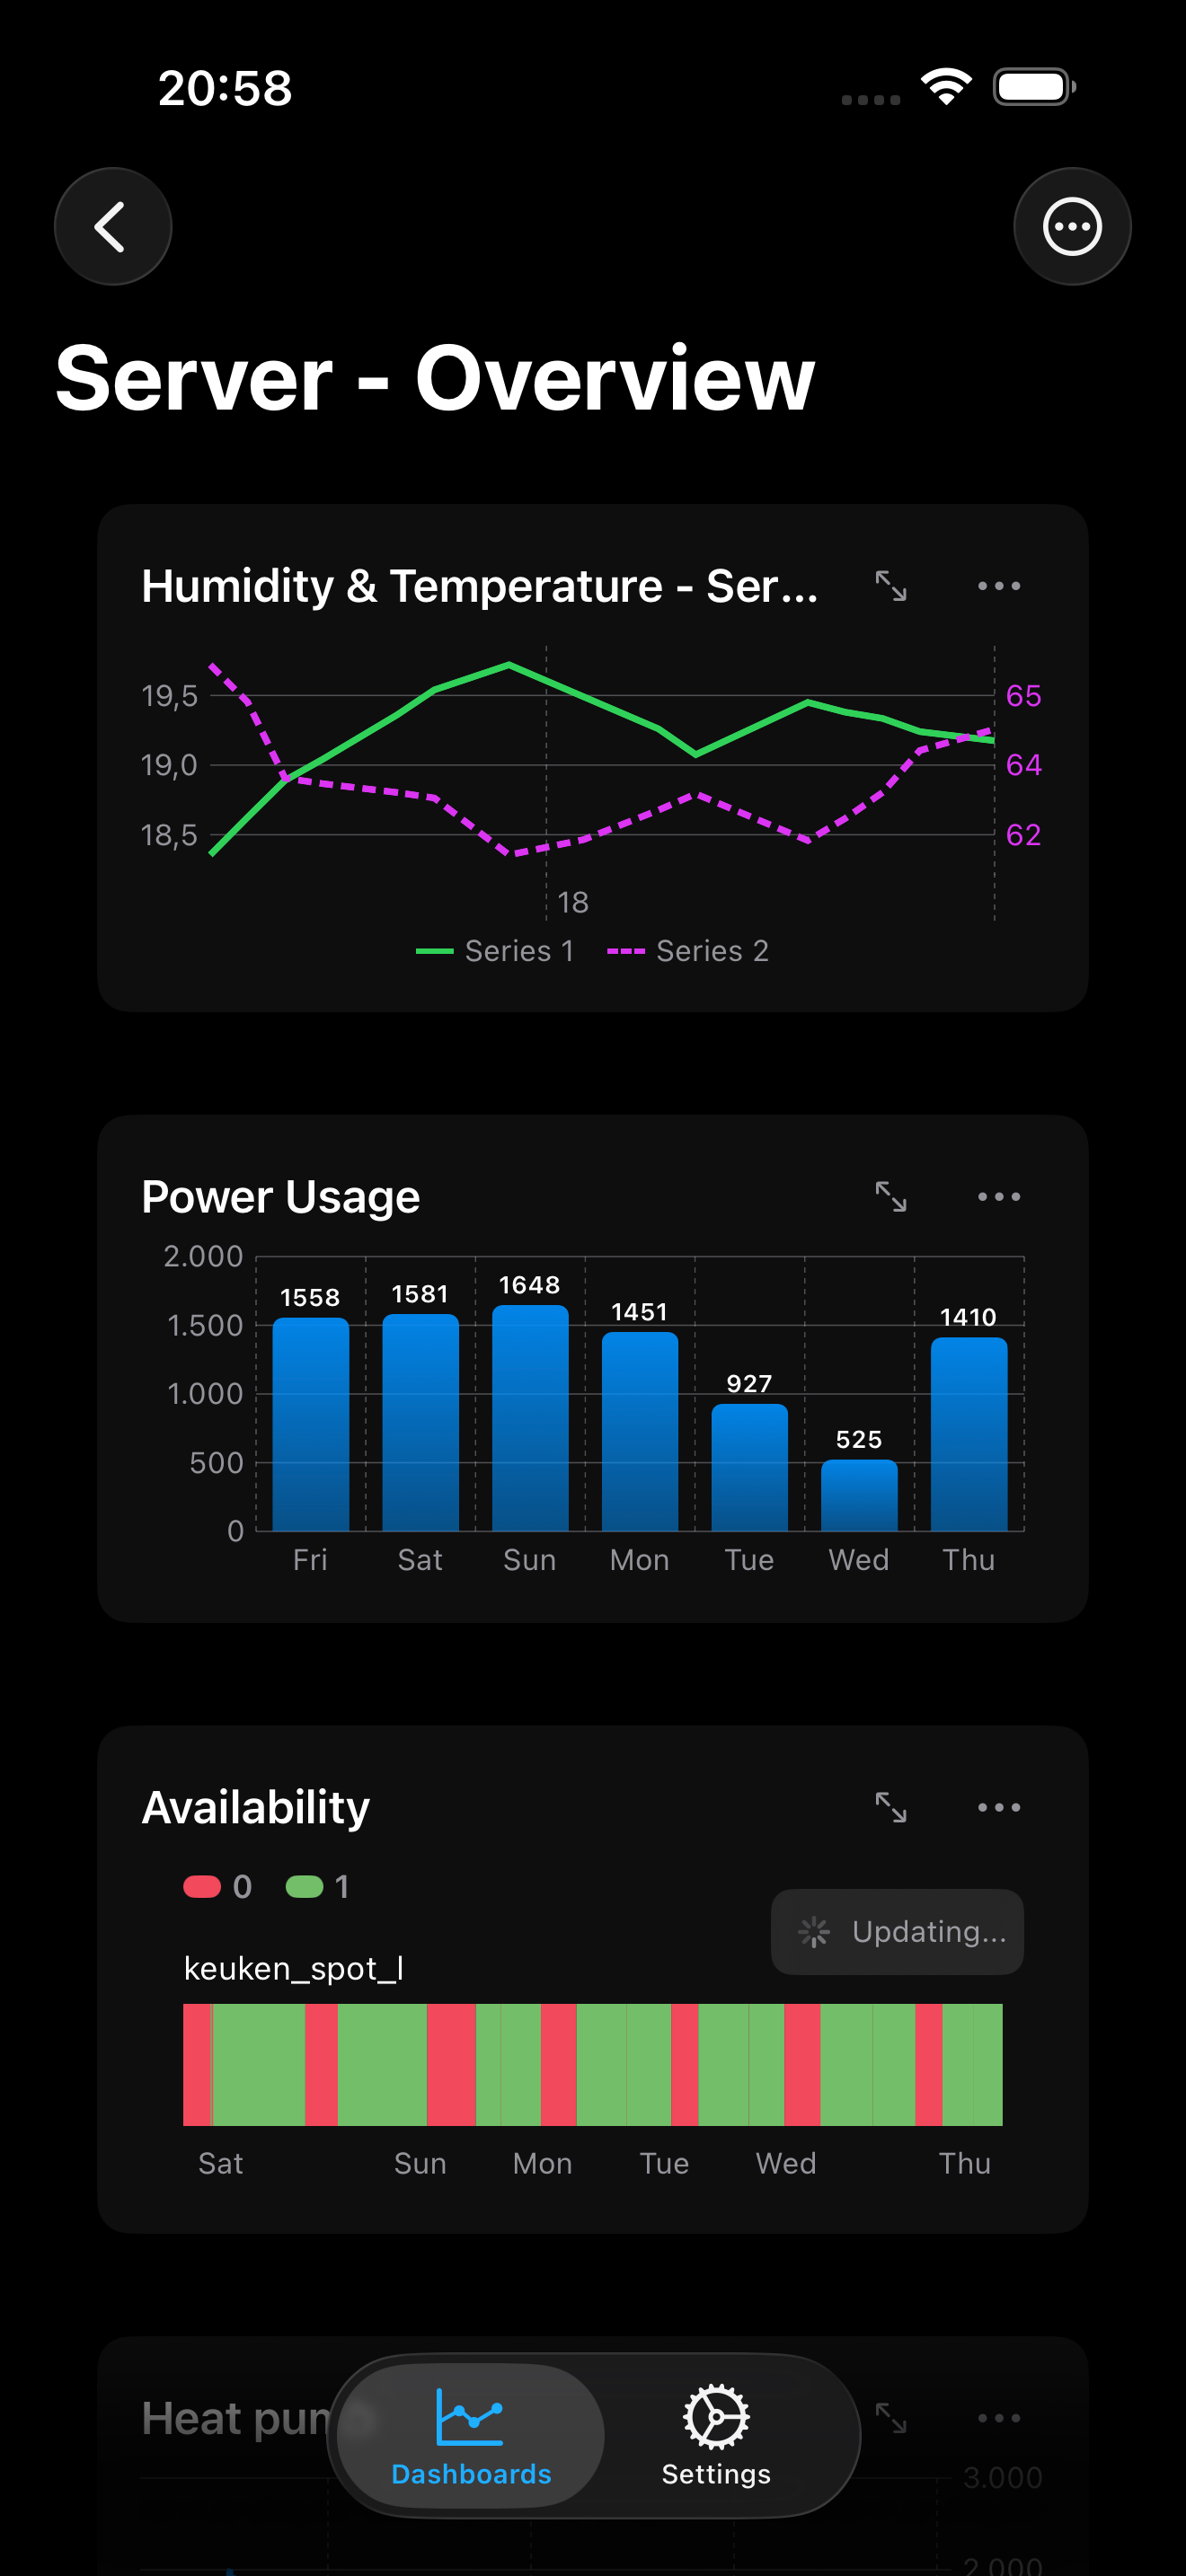
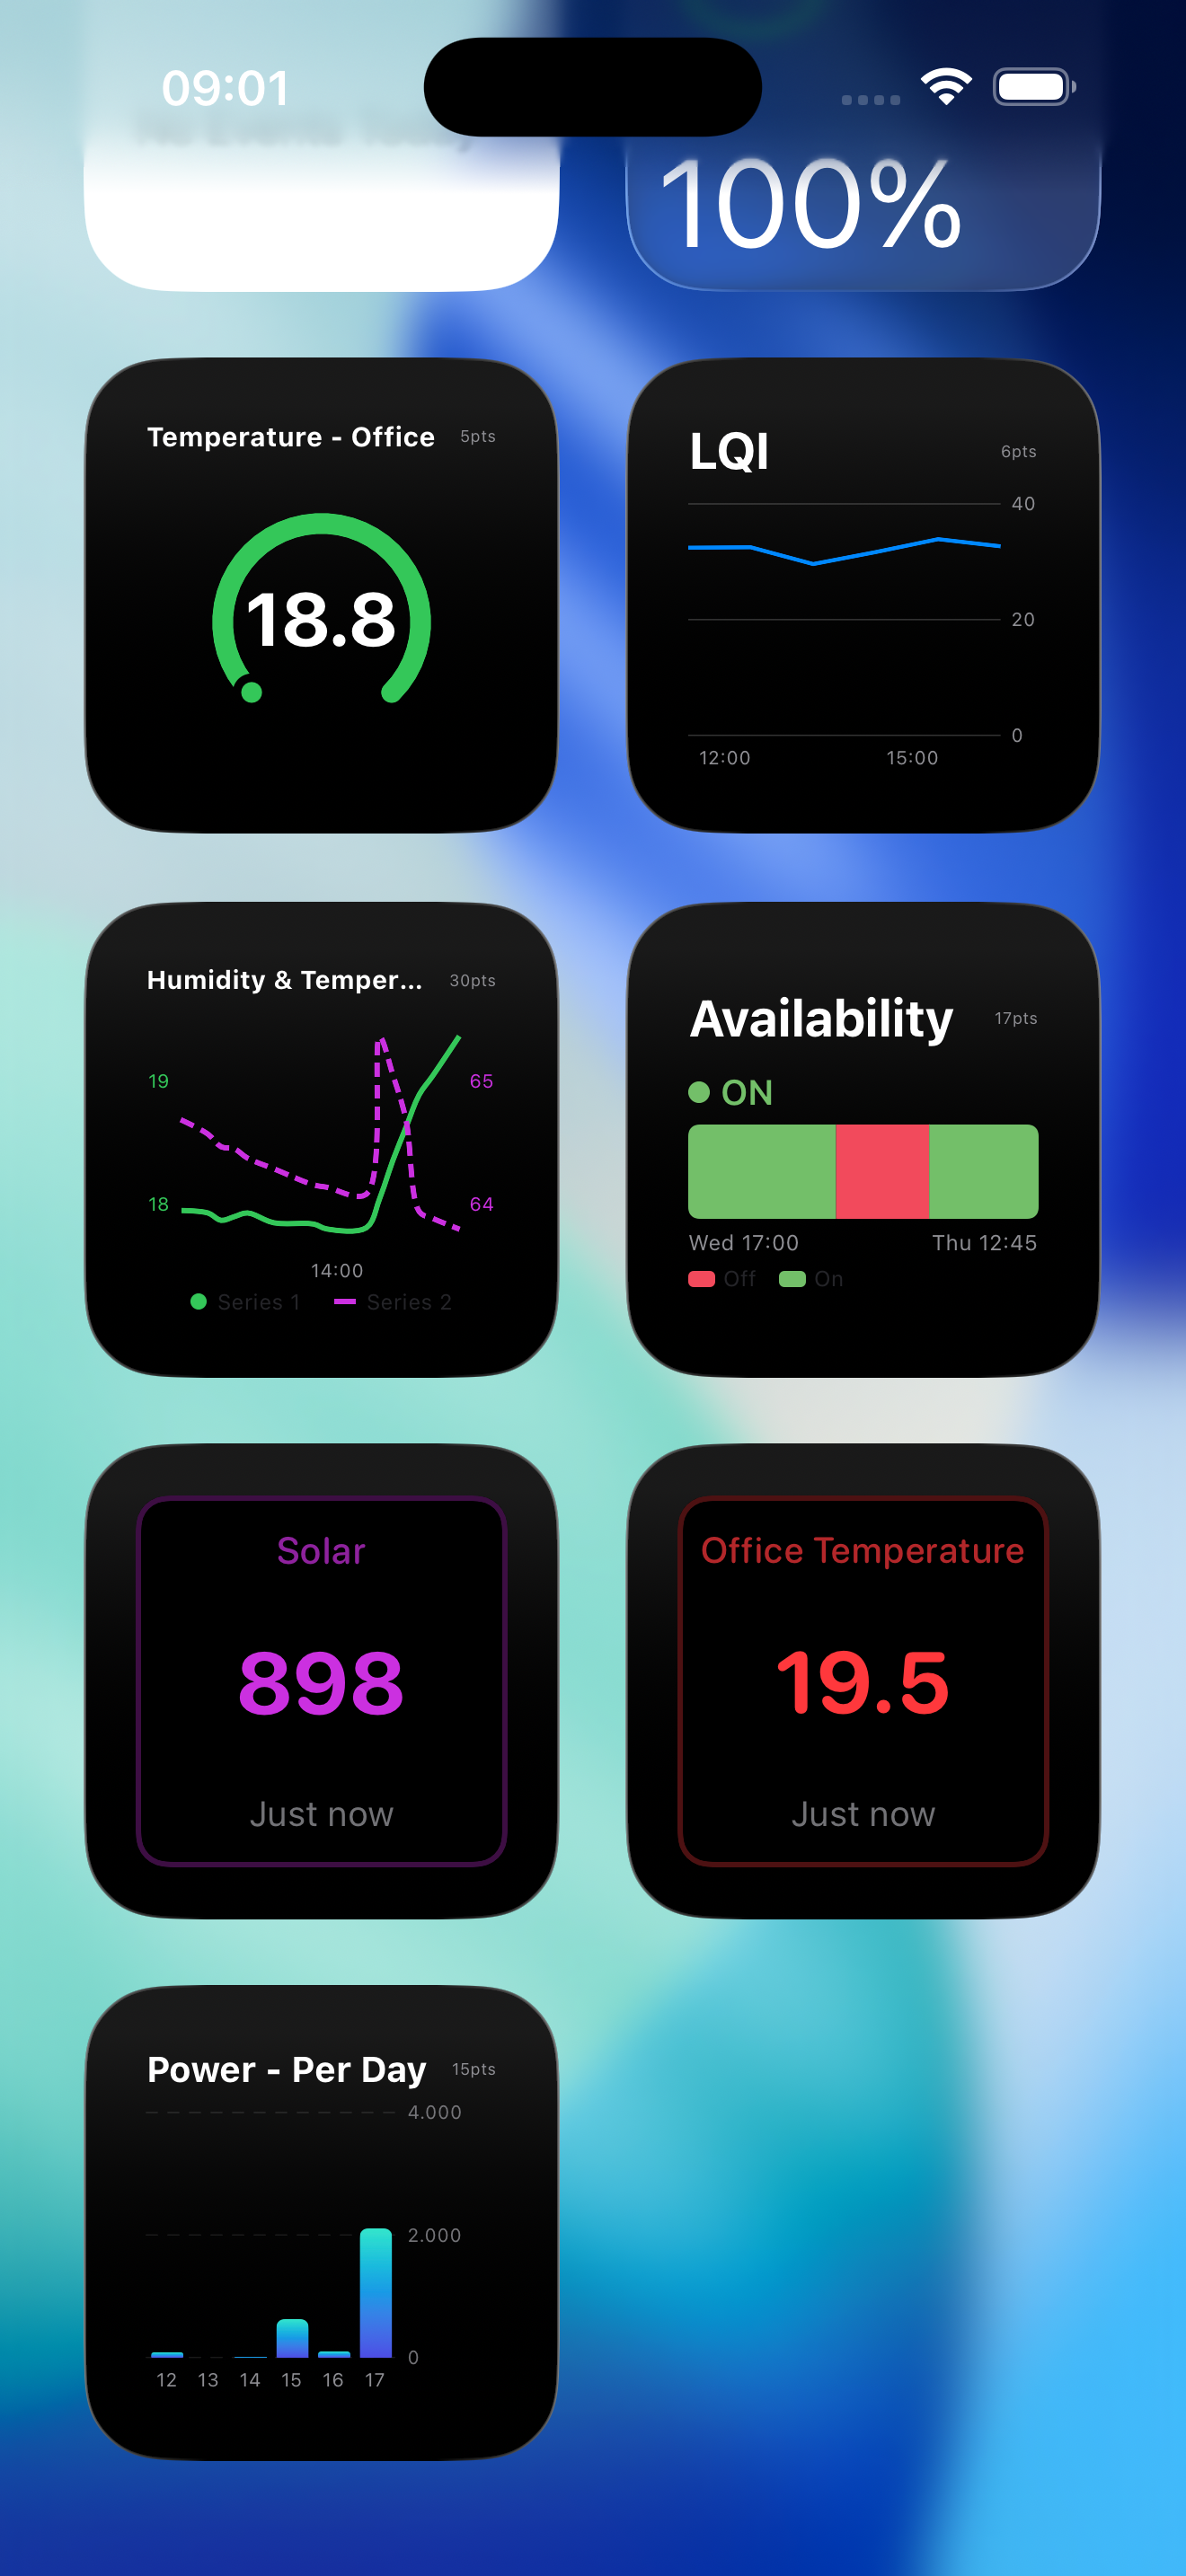
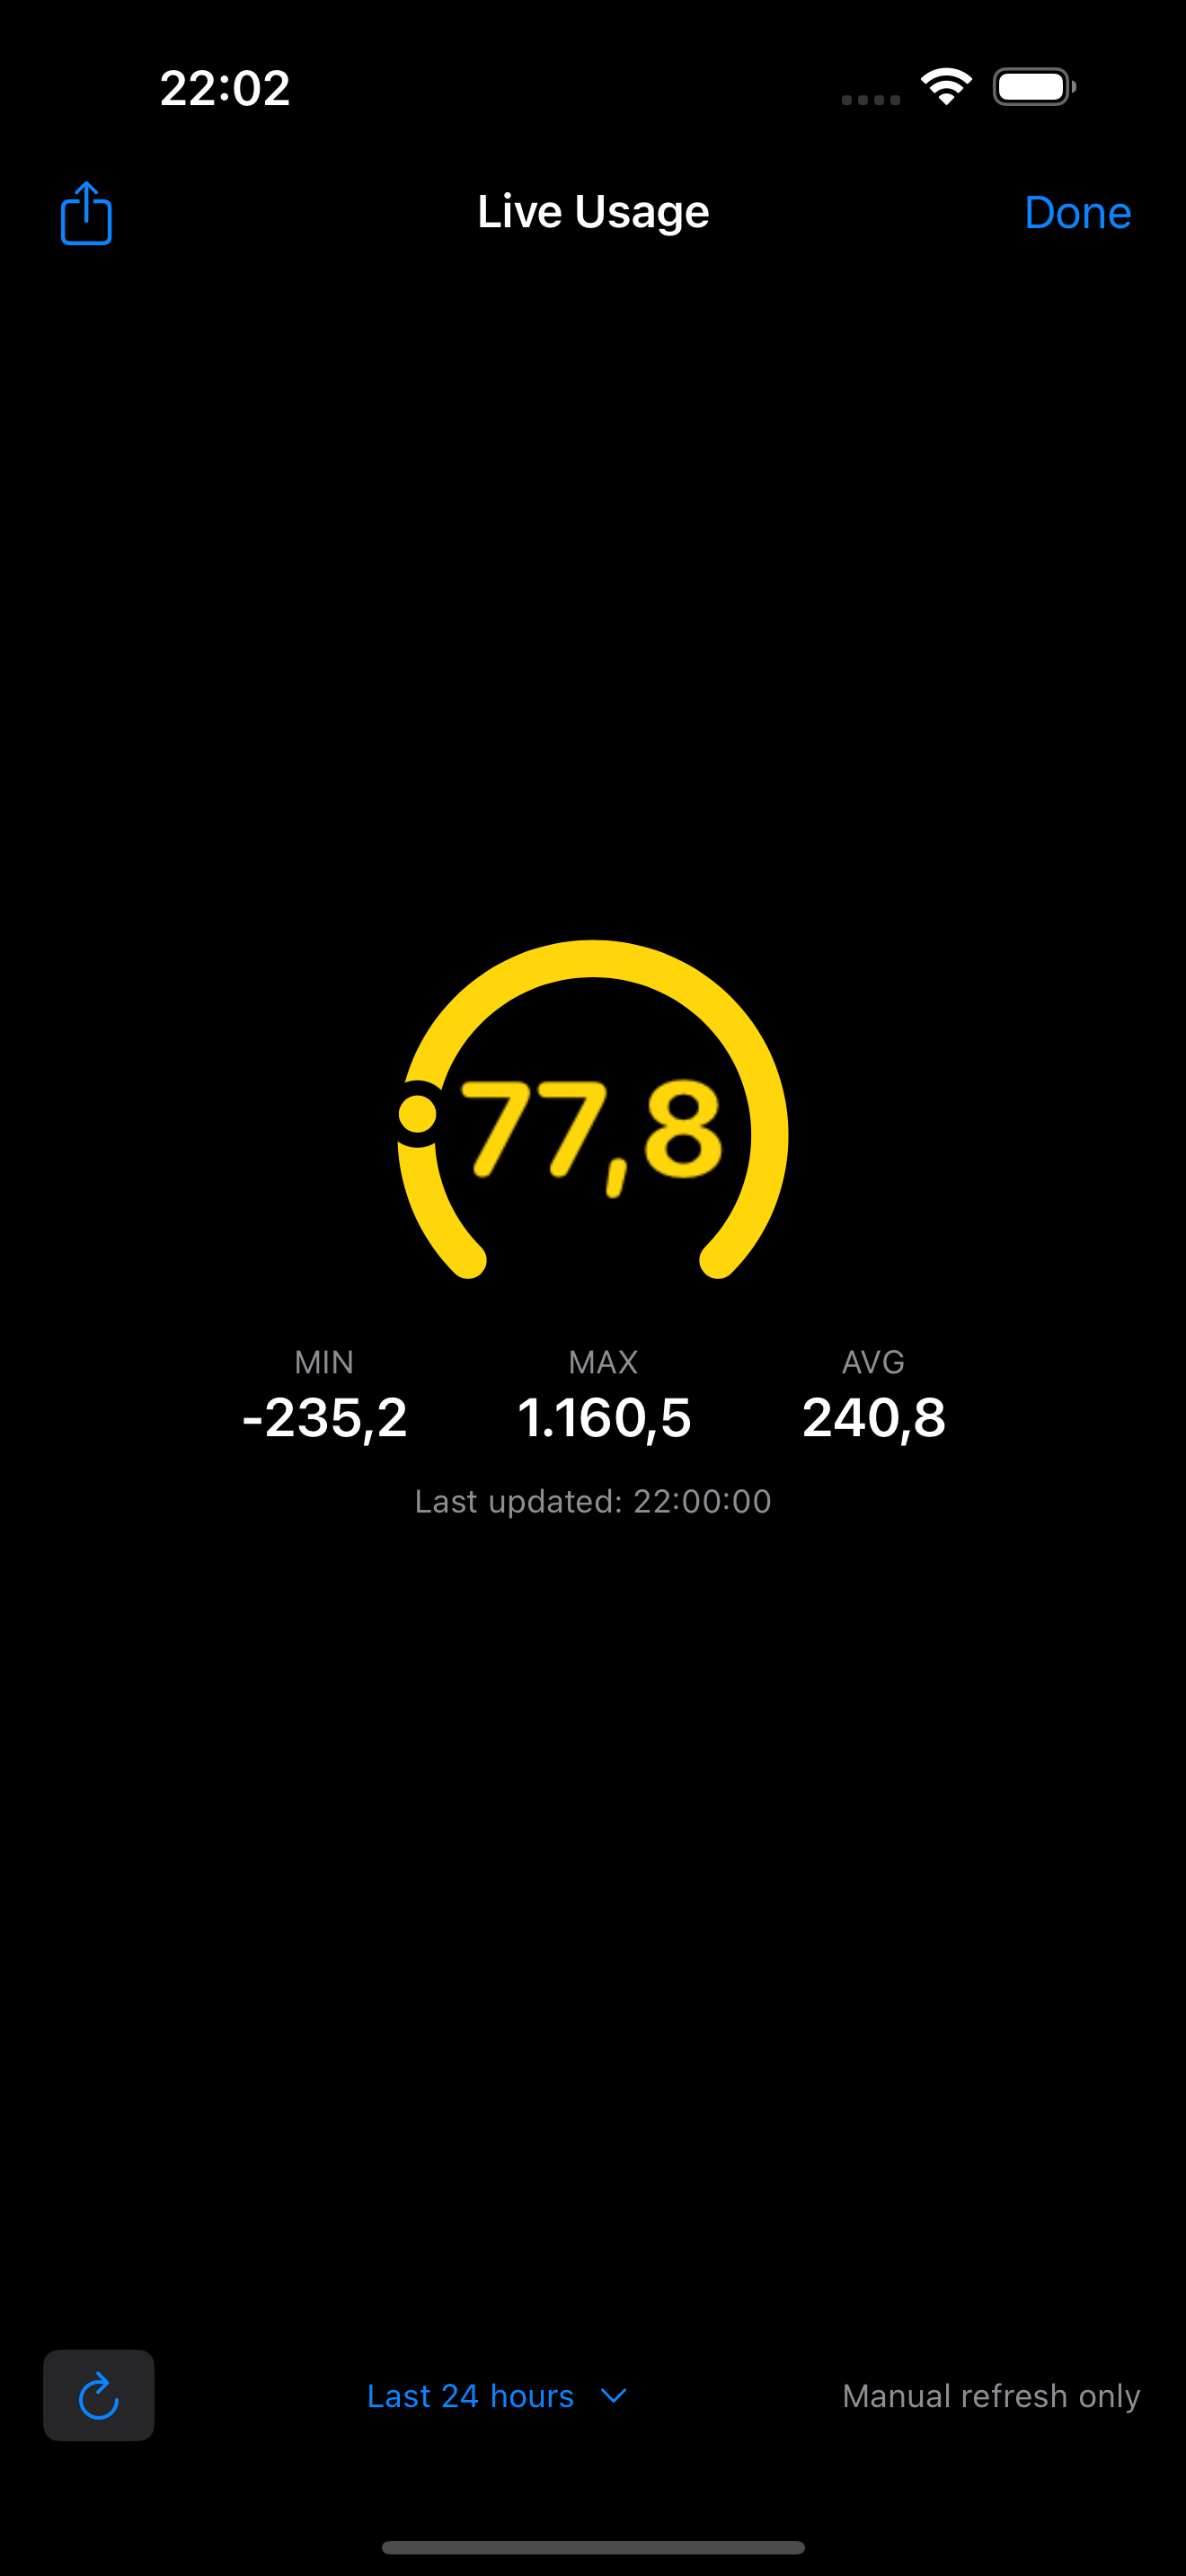
InfluxDB Dashboard for iOS
Your Data, Always Within Reach

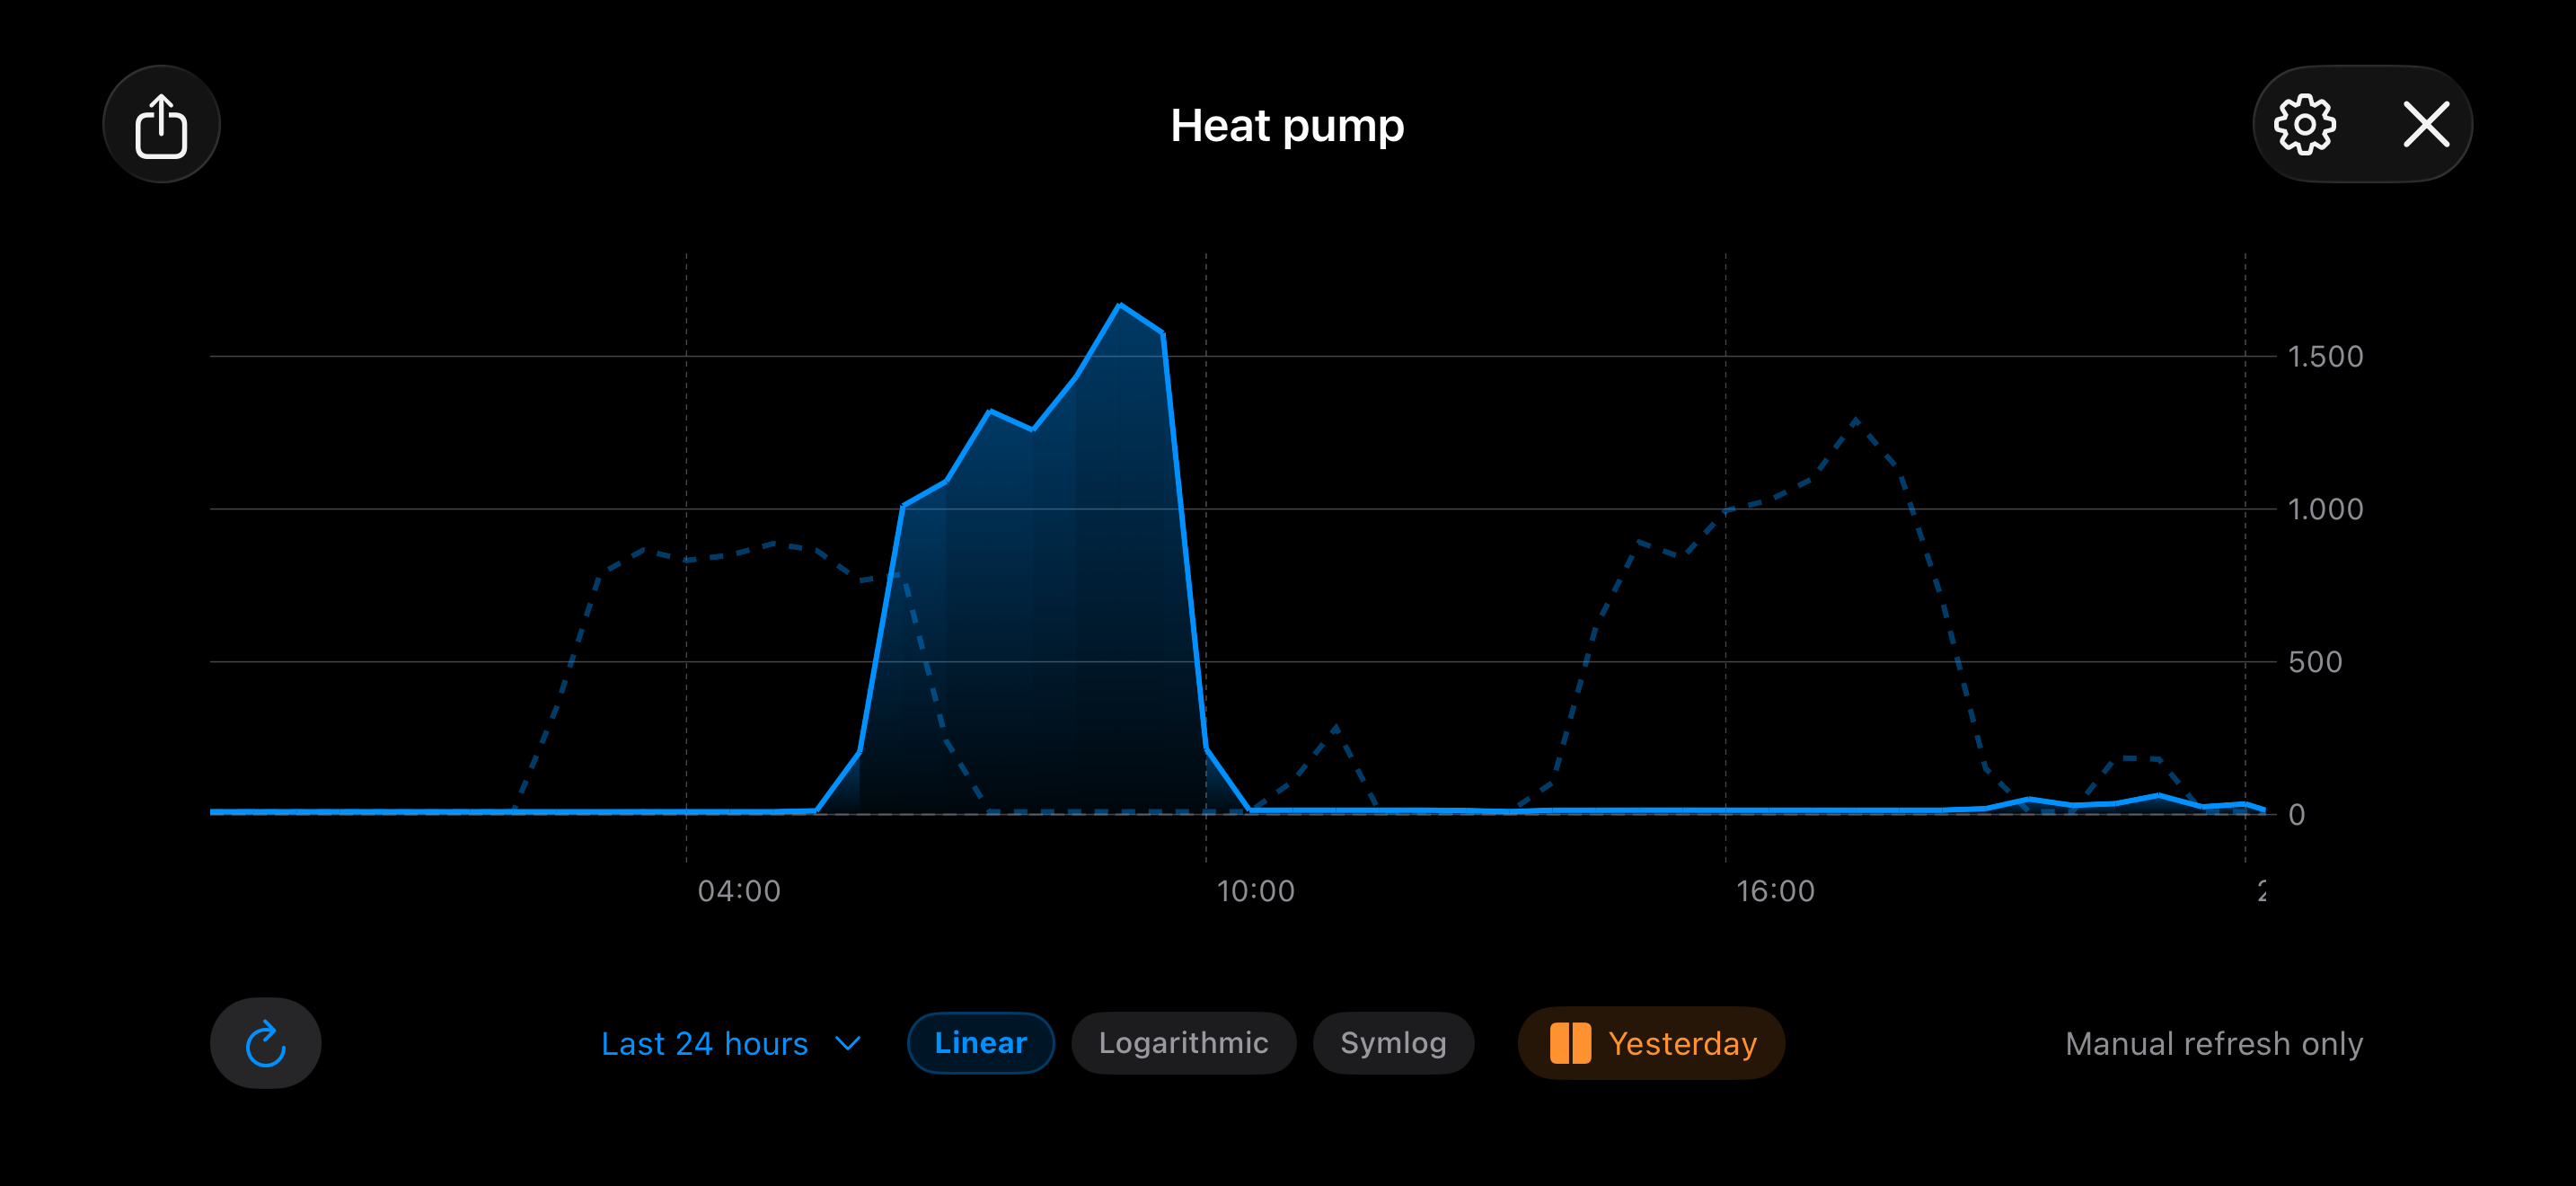
Transform your iPhone and iPad into a powerful monitoring dashboard. Real-time charts, widgets, and alerts for InfluxDB 2 OSS, InfluxDB 2 Cloud, InfluxDB 3 Core, and InfluxDB 3 Enterprise — beautifully designed for iOS.

Everything You Need for Mobile Monitoring

Professional-grade InfluxDB visualization designed specifically for iOS, with all the features power users expect.

📈

Real-Time Charts

Beautiful line, bar, gauge, and pie charts that update in real-time. See your data come alive with smooth animations.

🔌

All InfluxDB Versions

Full support for InfluxDB 2 OSS (Flux), InfluxDB 2 Cloud, InfluxDB 3 Core (SQL), and InfluxDB 3 Enterprise. Connect to any instance — local, cloud, or enterprise.

📱

iOS Widgets

Glance at your metrics from your home screen. Bar charts, gauges, badges, and state timelines right on your Lock Screen.

🏠

Home Assistant Ready

Perfect for monitoring your smart home. Visualize Home Assistant metrics stored in InfluxDB effortlessly.

🔒

Secure & Private

Your credentials are stored securely in iOS Keychain. Direct connection to your servers — no middleman.

Custom Dashboards

Create unlimited dashboards with drag-and-drop simplicity. Organize your metrics exactly how you want them.

Built for Every Industry

From DevOps to Smart Homes — monitor any time-series data on iPhone.

🖥️

DevOps & Infrastructure

Monitor Kubernetes pods, server health, and Telegraf metrics. Perfect for SREs and system administrators on the go.

🏭

Industrial IoT

Track sensor data from factory floor to mobile. Predictive maintenance and SCADA visualization in your pocket.

📈

Fintech & Trading

Visualize crypto prices, trading volumes, and financial time-series data with real-time updates.

🏠

Smart Home

Home Assistant integration, solar monitoring, energy tracking, and environmental sensors — all on your iPhone.

Works With Your Setup

Connect to any InfluxDB instance, wherever it's hosted.

🖥️

InfluxDB 2 OSS

Self-hosted v2 with Flux queries

☁️

InfluxDB 2 Cloud

Fully managed cloud service

InfluxDB 3 Core

Next-gen engine with SQL support

🏢

InfluxDB 3 Enterprise

Enterprise-grade deployments

🍎

iPhone & iPad

Universal app optimized for all screen sizes

🧩

iOS Widgets

Home Screen & Lock Screen support

Running a different InfluxDB version? Let us know and we'll look into adding support.

Smart Home Ready

The Perfect Companion for Home Assistant

Monitor your smart home metrics like never before. InfluxDB Dashboard connects directly to your Home Assistant's InfluxDB database to visualize:
  • Temperature & Humidity history
  • Energy consumption in real-time
  • Server performance stats
  • Custom IoT sensor data
InfluxDB Dashboard Home Assistant and IoT Monitoring

Frequently Asked Questions

Everything you need to know to get started with InfluxDB Dashboard.

Just download InfluxDB Dashboard from the App Store and connect to your server. Within minutes, you'll have beautiful real-time charts on your iPhone. Simply enter your InfluxDB URL, organization, and API token — and you're ready to go!

Absolutely! InfluxDB Dashboard works perfectly with Home Assistant data stored in InfluxDB. Monitor your entire smart home from anywhere — temperature sensors, energy usage, device states, and more. It's the perfect companion for your smart home monitoring needs.

InfluxDB Dashboard combines professional features with mobile simplicity. You get real-time updates, beautiful native iOS design, iOS widgets for your home screen, and support for InfluxDB 2 OSS, InfluxDB 2 Cloud, InfluxDB 3 Core, and InfluxDB 3 Enterprise. Plus, your data stays secure with direct connections — no cloud middleman required.

Yes! Your credentials are stored securely in iOS Keychain, Apple's encrypted credential storage. The app connects directly to your InfluxDB server — we never see or store your data. All connections support HTTPS for encrypted communication.

InfluxDB Dashboard offers a variety of visualization options: line charts, bar charts, gauge charts, pie charts, data tables, badges, state timelines, and dual-axis charts. Each chart type is optimized for mobile viewing with smooth animations and interactive features.

Yes! InfluxDB Dashboard fully supports InfluxDB v3 which uses SQL queries instead of Flux. You can write SQL queries directly in the app to retrieve and visualize your time-series data.

Absolutely! Any data collected by Telegraf and stored in InfluxDB can be visualized with this app. This includes server metrics, Docker stats, Kubernetes data, network performance, and any custom Telegraf plugins you use.

Both are excellent, but InfluxDB excels at high-cardinality IoT data with its purpose-built time-series storage engine. For long-term data retention and mobile visualization, InfluxDB paired with this iOS app provides a seamless experience for IoT monitoring.

Yes! If you store financial time-series data in InfluxDB (crypto prices, trading volumes, market data), you can create real-time dashboards to monitor your portfolio and trading metrics on the go.

Ready to Monitor Smarter?

Download InfluxDB Dashboard today and take your time-series data with you, wherever you go.

Download on App Store

Get in Touch

Have questions or feedback? We'd love to hear from you.